
Sequence analysis software for peptide display experiments
The innovative and user-friendly sequencing software tool AptaAnalyzerTM-Peptide exploits next-generation sequencing analysis to leverage and streamline the lead discovery process in biopanning experiments. Virtually any affinity selection or biopanning procedure like phage, yeast, or ribosome display profits from the integration of next-generation sequence analysis. The target addressing ligands range from linear to (multi)cyclic peptides and complex protein scaffolds displaying peptides in a more structured fashion. Our sequence analysis software makes it now very easy to digitalize biopanning experiments. It enables intuitive parsing of raw sequence datasets corresponding to original libraries or selection rounds, individual as well as comparative analysis of datasets, clear cut presentation of results in the form of tables and graphs, structuring data in projects and subprojects, and archiving them in databases.
Archiving and structuring of biopanning experiments
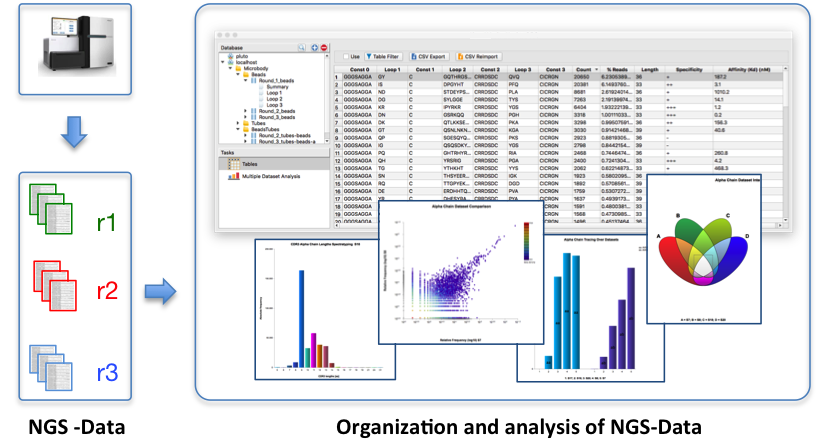
AptaAnalyzer™-Peptide supports the complete workflow in a very intuitive way: It is one tool for parsing of raw data, archiving of datasets, analysis of experiments and generation of results in form of table views and publication level graphics.
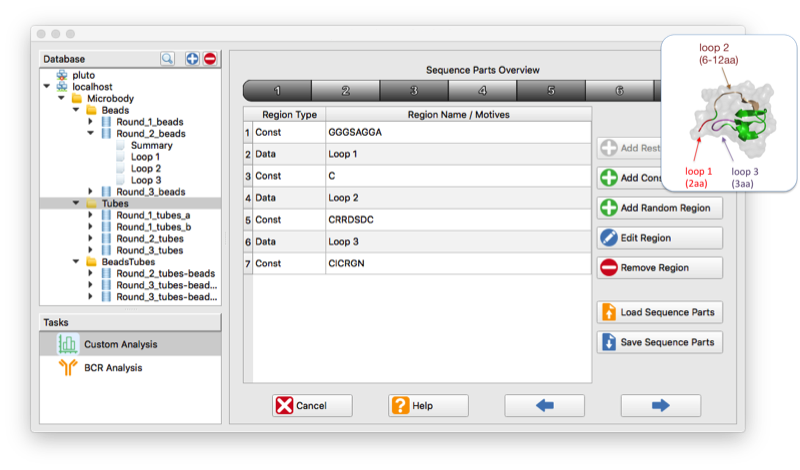
Experiments are organized in a database within projects and subprojects.
The “Sequence Parts Editor” enables the definition of even complex combinatorial molecules. Shown is an example of a Microbody®-scaffold containing three variable loops.
Quick and easy NGS data interpretation and easy generation of publication level material enables to exploit NGS data for actual experiments.
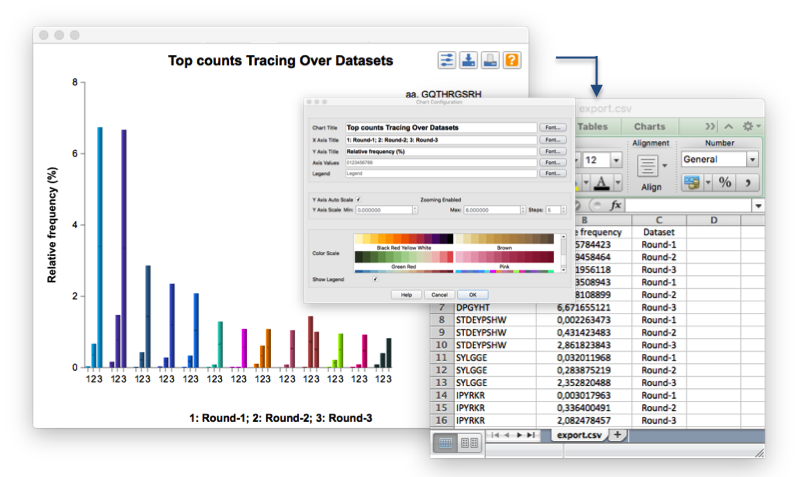
Publication level graphs can be configured and its data values can be exported into Excel.
Table views
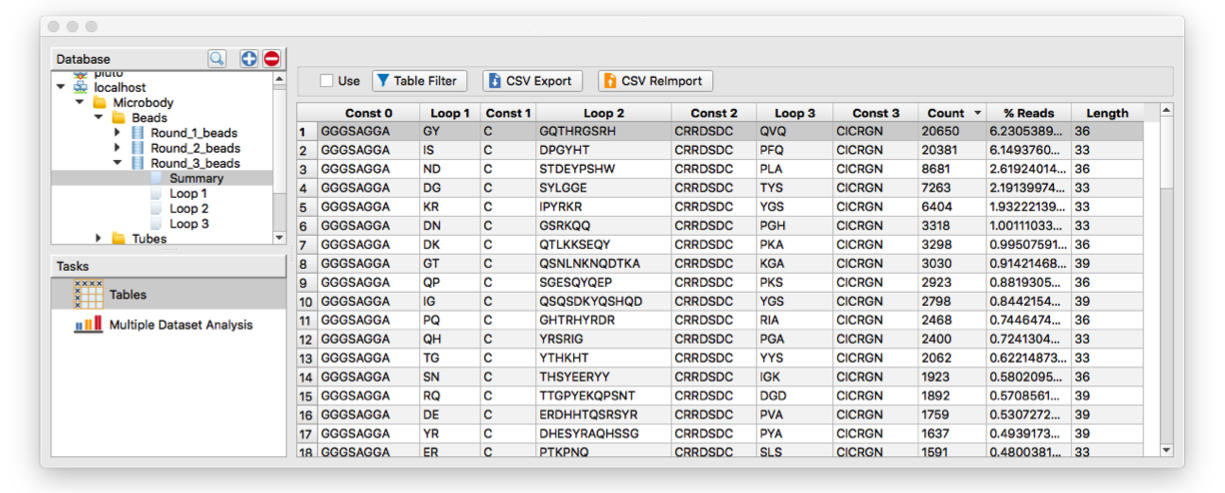
Overview on the level of clones with AptaAnalyzer™-Peptide. Full sequences are listed, whereby customer defined constant and variable regions are listed in separate columns.
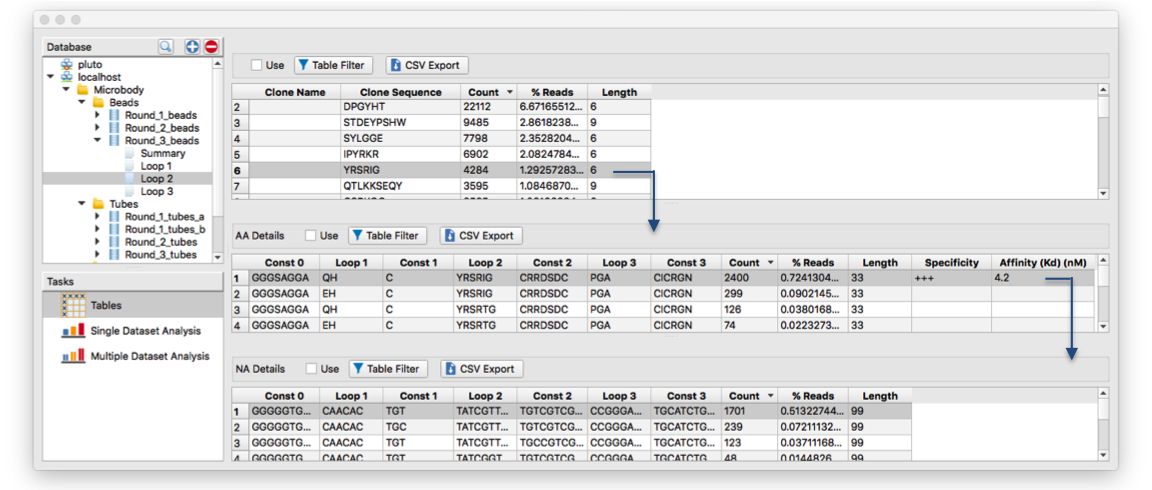
Three tables for each of the variable regions are given which provide interlinked information on three level of details. The table on the top shows “leader sequences” each representing a family.
The table in the middle gives sequences of all family members of a selected sequence and the table on the bottom shows the selected clone on the DNA-level.
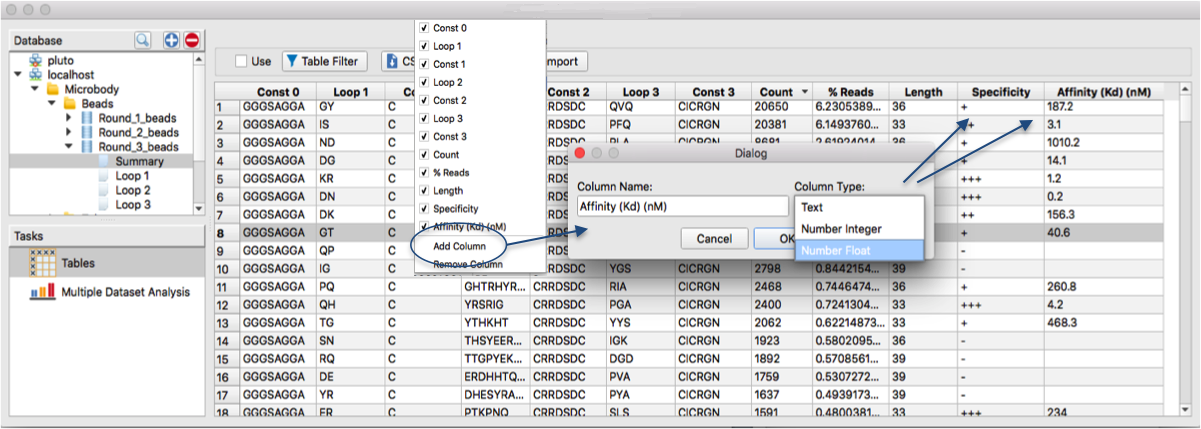
List of identified clones can be further expanded by user defined columns, for example: Experimental data like binding constants, specificity scores or virtual any other clone specific information can be included and stored in the database
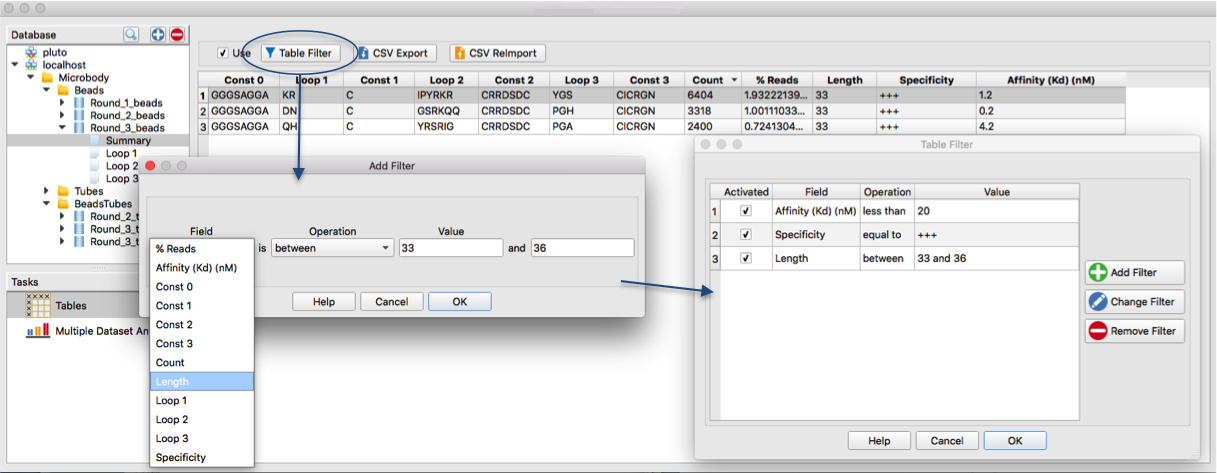
Custom defined table filters can be applied to view only clones matching defined criteria. User-defined columns, e.g. specificity or affinity, can be used as filtering criteria.
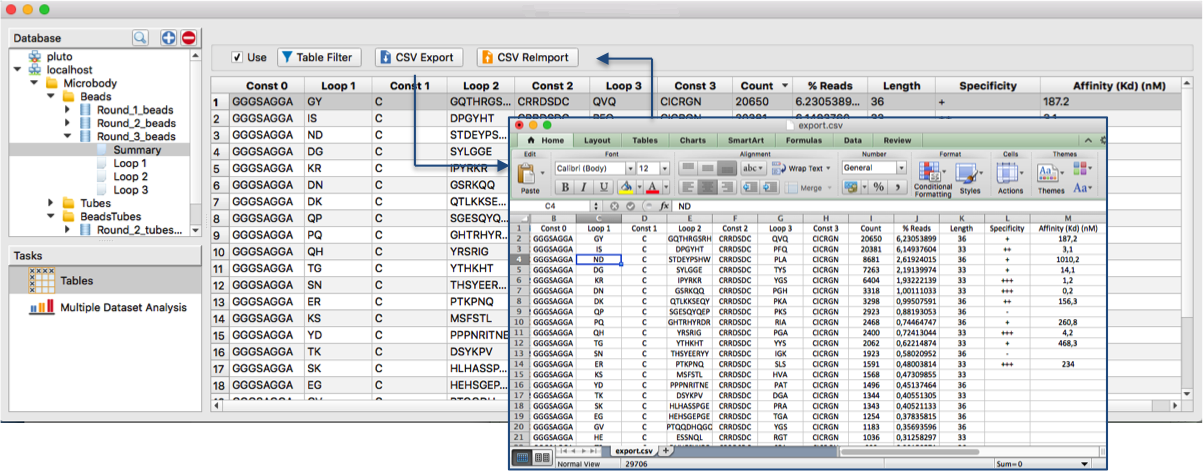
Tables (filtered or unfiltered) can be exported as “csv-files” for comfortable data transfer into Excel or other third party software.
Excel can be used to add columns with additional data. The reimport of edited tables updates the database with such sequence information, e.g. wet lab data like specificity or affinity.
Graphs for single dataset analysis
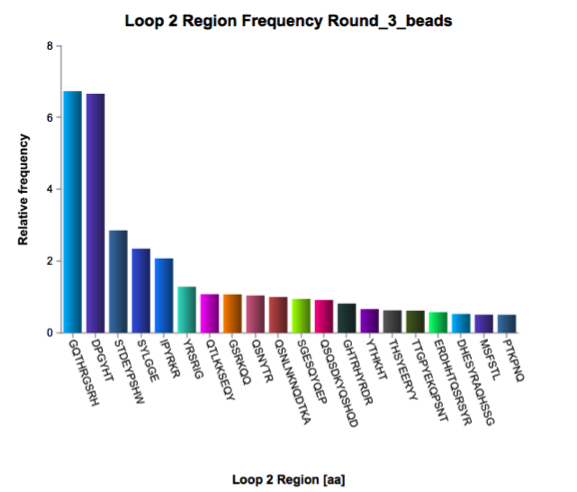
“Bar charts visualize the frequency of defined sequence regions. Shown are data of loop 2 of a Microbody® scaffold.”
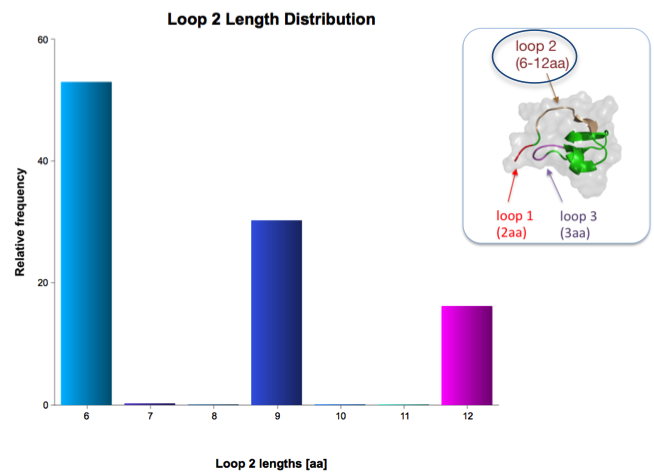
Bar charts visualize the length distribution (here of loop 2 of a Microbody® with dominant lengths of 6, 9 and 12 amino acids.
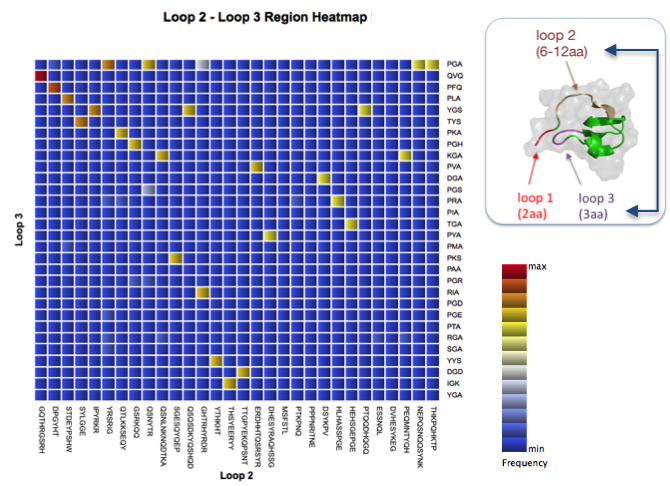
Heat map visualizes frequent combinations of defined variable regions (here loop 2 and 3 of a Microbody® scaffold).
Highly frequent combinations (red and yellow) are marked according to the colour ramp.
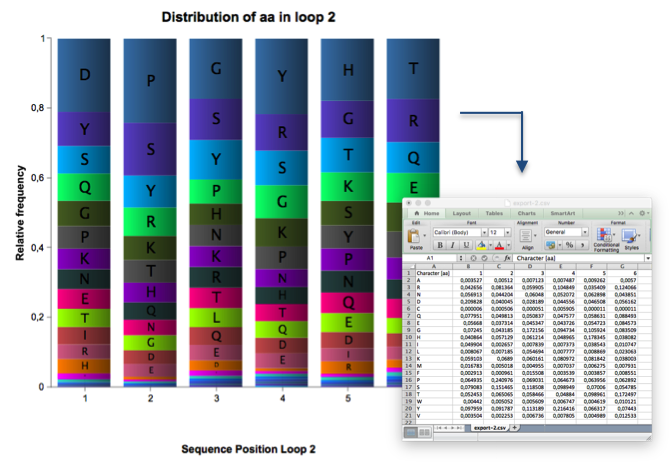
Stacked bar chart diagrams show the distribution of amino acids of defined variable regions, e.g. to asses the quality of starting libraries or to identify conserved and variable sequence parts of defined populations.
The data values of graphs can be exported to be further processed in Excel or other third party software.
Graphs for comparative dataset analysis
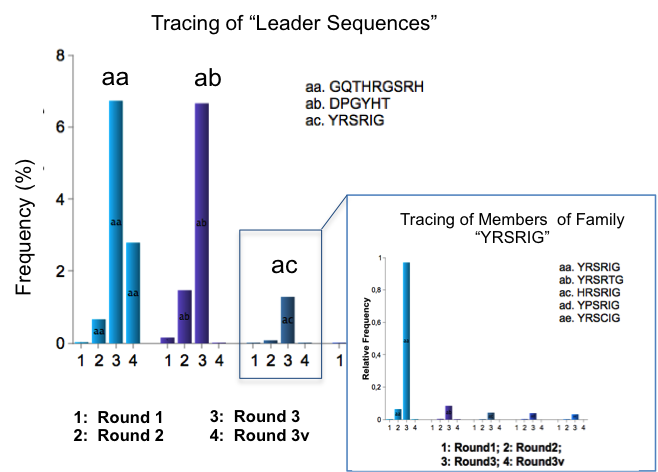
Bar chart series enable to track the frequency of sequences over multiple experiments, e.g. selection rounds.
Graphs give information on several levels of detail: A click on a defined bar chart series of “leader sequence” visualizes the frequency of its respective family members (blue framed).
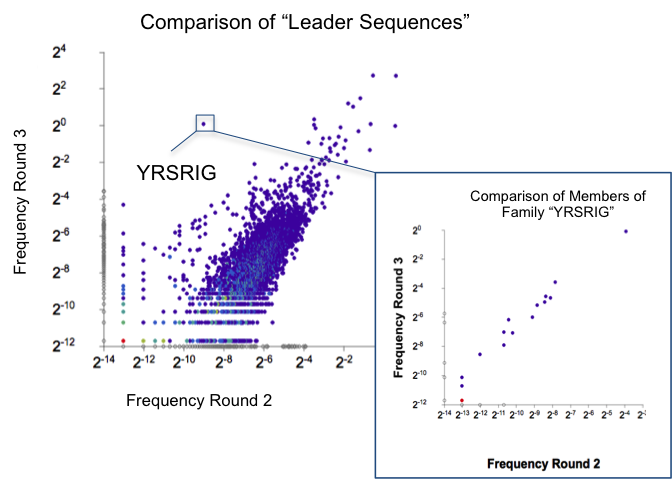
Scatter plots enable to compare the frequency distribution of complete clones or defined sequence regions of two experiments, e.g. selection rounds.
Graphs show information on several levels of detail: A click on a defined dot of “leader sequence” visualizes the frequency distribution of its respective family members (blue framed).
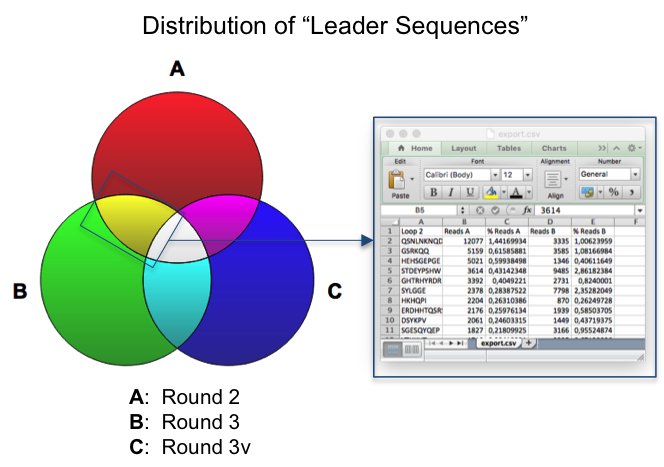
Venn diagrams enable to identify sequences that occur in defined experiments.
A click on respective segment (here yellow) extracts all sequences that are part of A (panning round 2) and B (panning round 3) but not of experiment C (variant of panning round 3).
We designed AptaAnalyzerTM-Peptide as an easy-to-use sequence analysis software, which provides a maximum flexibility in creating and storing analysis results in figures and tables. You can digitalize any NGS or Sanger sequence data sets provided in FASTA/FASTQ format.”
Get started with the analysis of your sequences with AptaAnalyzerTM-Peptide and profit from:
- Optimization of your selection platform by opening the black box of biopanning experiments
- Quality control of synthetic starting libraries enhancing biopanning techniques like phage display
- Sequence analysis of single or multiple peptide inserts
- Accelerated and advanced identification even of rare ligands by intelligent clustering of ligand families
- Direct linkage of sequence information with wet-lab data like affinity or specificity, which can be implemented into the database
AptaIT offers very flexible arrangements either as Pay-per-Use stick (dongle) with a predefined number of datasets (10, 50, 100, 250, 500) or annual license arrangements for unlimited use.
Please for further information.